Webex Meetings
Troubleshoot the API
Facing issues with Webex APIs or SDKs? Follow this proven troubleshooting process, and we promise you'll quickly identify the root cause and get back on track in a jiffy.
This guide provides a structured, methodical approach to diagnosing and resolving issues within your Webex API and SDK implementations. It is designed to equip developers with the essential steps for self-service troubleshooting, enabling you to systematically identify root causes, validate hypotheses, and leverage available resources. When self-resolution isn't possible, this document further outlines best practices for effectively engaging Webex Developer Support, ensuring that you can articulate your issue with precision and receive timely, targeted assistance.
An example workflow would look like:
- Initial Check: First see if the feature works directly within Webex, without relying on the API or SDK. This helps isolate the problem.
- Questioning the Changes: Ask yourself if you or your fellow app maintainers have made any recent changes to the app, network, or infrastructure that could be affecting functionality.
- Investigate and Review: Dive into documentation and examine network access, internet connectivity, and user login and OAuth details to pinpoint potential reasons for the issue.
- Testing Hypotheses: Analyze your application logs and perform simple API requests to test your theories and identify the main cause.
- Consulting Help: Leverage the AI Assistant for Developers for code generation guidance or to locate relevant documentation and APIs.
- Understanding Results: Review the gathered information to understand the outcomes. This will be useful if you need to reach out to Webex for further support.
anchorUnderstand the Problem
anchorCheck if the feature works in Webex without using the API. If you can reproduce the issue directly in Webex without API or SDK that should eliminate your application and in that case you should contact the Cisco Technical Assistance Center (TAC) to report the issue.
If the problem is with the API or SDK, focus on narrowing the scope of the issue. Is it an internet connectivity issue, incorrect API response or behavior, are you receiving a non-successful HTTP response status code (such as 4xx or 5xx), or an authentication error?
Verify Network Connectivity
Ensure your device or server has internet access and can reach the Webex servers. For webhook endpoints receiving HTTP requests from Webex, verify that your devices or web server is accessible from the internet. For more details about the network and internet requirements for the Webex service please refer to the Webex Network Requirements guide for more details.
Review Authentication
Confirm that your authentication credentials (such as API keys, Client ID, Client Secret, or tokens) are correct and have not expired. If you are using an Access Token from an Integration or Service App you can make a GET request to https://webexapis.com/v1/people/me to verify the Access Token is working (you will need to have the spark:people_read scope for this API). Verify that any Webex user account being used can login to Webex.
Check the Documentation
Always refer to the API documentation to ensure you're using the correct endpoints, methods, and parameters. This would also be a good time to check with the AI Assistant for Developers for code generation guidance or to locate relevant documentation and APIs.
Review Recent Changes
Check for any recent changes in your code or the API that might have caused the issue. Look at the API change log (Webex Suite, Webex Contact Center) well as the documentation for the individual requests/endpoints being used by your application for updates. Verify that your software or SDK version is up to date and still supported by reviewing the Webex API and SDK Support Policy.
Consult Logs and Error Messages
Examine your server logs or application error logs for additional insights. When the Webex REST API returns an HTTP Error code response the HTTP Response body will provide more details about the cause of the error including a trackingID we can use to locate your issue in our logs, so it is important to log the HTTP Response body when an error is encountered.
Test with Simplified Requests
Simplify your requests to the bare minimum required fields as indicated in the API Documentation to help isolate the problem.
For SDK Related Issues Attempt to Reproduce Problems in our Sample Apps
Reproducing your issues using our sample apps can help determine whether the problem lies with our SDK or is an implementation issue in your code. You may be able to resolve your implementation issues by referring to the source code of these samples:
anchorIf You’re Still Stuck: Engage Developer Support
anchorIf you have not resolved your issue at this stage, it is likely time to open a ticket with Developer Support. With the guidance provided below, document the issue, environment details, and steps to reproduce the issue and API response trackingID. Once you have gathered all the necessary information open a Developer Support ticket using the Support option provided in the navigation menu at the top of this page.
Best Practices for Reporting Issues
Before engaging Webex Developer Support, it is important to gather and provide as much details as possible of the issues you are experiencing. This will improve the quality of support you are provided and reduce the time needed to help identify and resolve your issue.
If you are having multiple issues, it is very important to separate those issues into individual tickets to avoid any misunderstanding or confusion. Some issues may take longer to resolve which is another reason to open one ticket per issue.
When reporting issues to Webex Developer Support please format your content as shown below.
Description
Provide a concise description of the issue being experienced.
Environment
Issues can appear in a particular environment and not others. For example, you may encounter issues when running the website on Firefox, or an app malfunctions only when running on an iPhone X. These issues can only be identified with cross browser, OS, or device tests.
Within this environment section please provide the following details:
- Device Type/Model: Hardware and specific device model.
- OS: Operating System name and version.
- Software type, name, and/or version: Provide details about the software (application/browser, sdk, or coding language) which is being tested, and in which the issue has appeared.
- User or Tester: Name and email of the user who encountered the issue.
- Connection Type/Strength: If the issue is dependent on the internet connection (4G, 3G, Wi-Fi, Ethernet, VPN, Proxy) mention the connection type and strength at the time of testing.
- Rate of Reproduction: Specify the frequency (intermittent or continuous) and the number of times the issue has been reproduced.
- Prerequisites: List any specific conditions or setups required before reproducing the issue, such as user permissions, necessary configurations, or data states.
Steps to Reproduce
Provide a numbered list of detailed steps taken that produced the issue you are reporting so that Developer Support can follow them precisely and see the issue for themselves. It is also important to provide both the expected results from following the steps and a clear description of the actual results where the issue is observed. The Actual Results should include as much details as possible, including error messages, screenshots, or screen recordings when possible.
Logs and Visual Proof of Issue
To effectively troubleshoot issues, it's important to gather logs from the SDK, application, or API requests and responses, depending on the type of problem you're encountering. API responses typically include a tracking ID, which assists in locating relevant logs in Webex to address your concerns.
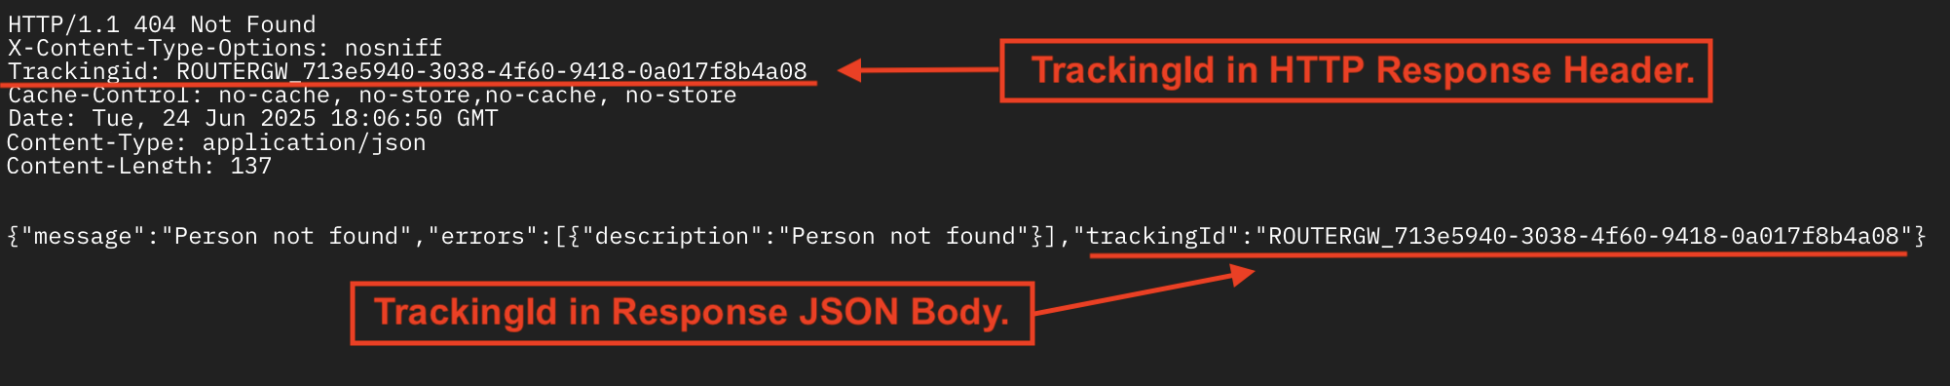
When an error response is generated, the API usually embeds the tracking ID within the JSON body of the HTTP response. However, in some instances, particularly when a successful HTTP 200 status code is returned, the tracking ID may not appear in the response body. In such cases, you'll need to examine the HTTP response headers for a trackingId header, which should contain the tracking ID value.
Rest API response example showing trackingId location in Header and response body:
For issues affecting user experience (UX), it is advisable to provide screen recordings or screenshots of the problem, accessible via Vidcast or your preferred screen recording utility.
Template for reporting issues to Developer Support
Please use this template along with the guidance above when reporting issues. This template provides a comprehensive structure for reporting issues, ensuring clarity and completeness in communication with our teams.
Following these steps will help facilitate effective troubleshooting by the Webex Developer Support team. Adjust elements as necessary based on the actual issue and environment details.
Notes:
- Be sure to fill in placeholders with specific information relevant to your issue.
- Include as much detail as possible in descriptions and logs for better troubleshooting.
- Review the template for completeness and accuracy before submitting your ticket.
- For details on collecting logs, see the following section, “Collect Browser and SDK Logs” below.
API Support Template
Use this template for your API support requests:
Description: [concise description of issue]
Environment:
  Device Type/Model: [Device manufacturer, model, and version]
  OS: [computer, mobile, or device Operating System]
  Software type, name, and/or version: [Provide details about the software used when issue was encountered]
Tester/Affected User: [Name/email of the user who encountered the issue]
Connection Type/Strength: [Internet/network Connection type and other detail like VPN/Proxy involvement]
Rate of Reproduction:
  [frequency (intermittent or continuous) and Rate issue is occurring]
Prerequisites:
  [Prerequisites/Conditions resulting in issue]
Steps to Reproduce:
    1.[step 1 description]
    2.[step 2 description]
    3.[step 3 description]
    4.[repeat additional steps as needed with as much detail as possible]
  Expected Results:
    [provide description of the expected results/behavior]
  Observed Results:
    [provide description of the actual results being experienced]
Attach Logs and other supporting materials:
    [screen recording, screenshots, sample code, etc]
Example Request Template
Here is an example of a completed template reporting an issue to Webex Developer Support. This example demonstrates how to fill out the template with specific details of an issue being reported to Developer Support.
Description:
  The Open Together functionality fails to direct users to the dashboard page, presenting a "404 Not Found" error instead.

Environment:
  Device Type/Model: Apple iPhone X
  OS: iOS 14.4
Software/Development Language Details: Webex embedded app SDK version 1.3.5 in Webex App 45.3.1
Tester/Affected User: John Doe, johndoe@example.com
Internet/Network Connection Type and Other Details: Wi-Fi with VPN enabled

Rate of Reproduction:
  Continuous; reproduced every time login is attempted

Prerequisites/Conditions Resulting in Issue:
  User must be connected to VPN; only occurs when VPN is active

Steps to Reproduce:
  1.Open Browser:
    Launch Webex Meeting on the iPhone X.
  2.Navigate to Embedded app:
    Open “Example” Embedded App from Apps panel in meeting.
  3.Launch Feature page:
    Click on component located in main menu of embedded app home page.
  4.Perform Action:
    Click on the "Open Together" button located at bottom of embedded app.
  5.Check for result in participant view:
    Observe the Embedded Apps behavior after submitting the shared page loads.

Expected Results:
  After clicking "Open Together", the participants Meeting App should open the embedded app to the shared URL [https://www.example.com/dashboard].
  The dashboard should display a welcome message, "Welcome, John Doe!".

Observed Results:
  After clicking "Submit", the user is redirected to an error page with the URL [https://www.example.com/error].
  The error page displays a message, "404 Not Found".

Attached Logs and Other Supporting Materials:
  Screen Recording: A recording of the login process showing the issue can be accessed here: https://vidcast.io/example-login-error.
  Screenshots: Included are screenshots of the error page.
  Sample Code and logs: Attached logs and snippet of the JavaScript code used for the Open Together functionality.
anchorCollect Browser, SDK and Device Logs
anchorFor Browser based issues including browser SDKs please follow the steps below to enable and collect logs.
Open Developer Tools
Each Browser will have different ways to open the Developer Tools which may change between their releases, so it is best to reference the browsers documentation as much as possible:
- Google Chrome: https://developer.chrome.com/docs/devtools/open
- Microsoft Edge: https://learn.microsoft.com/en-us/microsoft-edge/devtools/overview#open-devtools
- Firefox: https://firefox-source-docs.mozilla.org/devtools-user/#the-core-tools
- Safari: https://developer.apple.com/documentation/safari-developer-tools/develop-menu
Enable Optional Logging Features in Developer Tools
Before duplicating your browser-based issues the following settings may be needed to ensure the logs contain all the necessary information to troubleshoot your issues.
Please enable the following in the Console settings:
- Timestamps
- Preserve Log
- Log XMLHTTPRequests (Chrome and MS Edge only)
You should also enable Preserve Log in the Network settings.
Once these settings are enabled you can begin collecting logs while you reproduce the issues you are experiencing with our API or SDK.
Capture the HAR Logs
For most popular browsers you can follow the Generate a HAR File in Your Browser guide in our Webex Help website to capture and save the HAR(HTTP Archive) log while duplicating your problem. If you do not see your browser listed here please reference the documentation provided by the browser developer for guidance on collecting logs.
Capture the Console Logs
With the Developer Tools panel open (see instructions above) click on the Console tab. After reproducing the issue right-click within the console output and select Save as or Save all... to export the log to a file.
Enable Additional logging in the Webex Browser JS SDKs
If your issues are related to the Webex JavaScript based SDK’s it is also important to increase the log level to info or debug for you to capture additional logging details. The added logging will increase the size of the logs generated by your application, so it’s not usually recommended to set the log levels once you have deployed your application to your production environment.
For the Webex Meetings and Messaging features of the SDK see the “Change the Log Level Within Your App” content in the Troubleshooting section of our Browser SDK Guide. To set the log level for our Webex Calling SDK see the Logger Configuration content in the Webex Calling Configuration Details section of our Web SDK Quickstart guide.
Capture WebRTC Dump Logs for WebRTC (Web Real-Time Communication) Media Issues in the JavaScript SDK
Collecting WebRTC dumps and other related logs can be valuable for diagnosing issues with WebRTC in your application. Below we have provided the instructions for doing so in Google Chrome, Microsoft Edge, Firefox, Safari. By following these instructions, you can collect WebRTC dump logs for further analysis and troubleshooting in each of these major browsers. Please also note that the location and availability of these settings may change with updates to the browsers, so you may need to reference the documentation provided by the Browser developer.
Google Chrome and Microsoft Edge
- In a new tab, Open WebRTC Internals. For Chrome enter
chrome://webrtc-internals/in the address bar and press Enter. For Microsoft Edge enteredge://webrtc-internals/in the address bar and press Enter. - Start your Webex Call or Meeting using the Webex JavaScript SDK in another tab to initiate the WebRTC Session.
- After duplicating issue and while call is still active, return to the WebRTC Internals tab click the Create a WebRTC-Internals dump.
- Click the Download the "webrtc-internals dump" button to save a file containing the WebRTC logs and statistics.
Mozilla Firefox
- In a new tab, type
about:webrtcin the address bar and press Enter. - Enable Auto Refresh in all fields if not already enabled.
- Start your Webex Call or Meeting using the Webex JavaScript SDK in another tab to initiate the WebRTC Session.
- After duplicating issue and while call is still active, return to the tab with
about:webrtcalready opened. - Click the Save Page button at the bottom of the page and save the file.
Apple Safari
- Open the JavaScript Console from the Develop menu.
- Go to the Web Inspector Settings (gear icon) in upper right corner.
- On the Console Settings tab and ensure WebRTC logging is set to Verbose.
- Click on the Console tab in the Web Inspector.
- Start your Webex Call or Meeting using the Webex JavaScript SDK in another tab to initiate the WebRTC Session.
- After duplicating issue click in the Console and use keyboard combination Cmd + A to select all followed by Cmd + S to save to a file.
Collect Embedded Apps Logs
Please attempt to duplicate your issues in our sample apps as well (see the list of Samples here: Sample Apps) to verify if your issues are specific to our SDK. If you cannot resolve your issues by referencing our Sample Apps or have experienced the same issues in our Sample App, please follow the instructions below for collecting logs before reporting the issue to Developer Support.
For instructions on enabling and opening Developer Tools for the Webex Apps and different Operating systems please follow the instructions Embedded App Developer guide On the Webex Developer Portal. Once enabled you can follow the Capture HAR logs and Capture Console logs just like you would in a regular web browser, like mentioned in our Browser SDK content above to gather the logs while duplicating your issue with our Embedded Apps feature including the related SDK.
Like the other JavaScript based SDK’s the log levels can also be changed as described in the Embedded Apps reference guide.
Collect Mobile SDK Logs
Before collecting logs, it is always recommended to attempt to replicate problems using our sample applications (see the list of Samples here: Sample Apps) to determine if the issues are specific to the SDK or your implementation.
If you cannot resolve your issues by referencing our Sample Apps or have experienced the same issues in our Samples, please follow the instructions below for collecting logs on both Android and iOS SDKs before reporting the issue to Developer Support.
iOS SDK
To effectively troubleshoot the Webex iOS SDK, several methods are available to enable additional logging and gather logs.
First, you can refer to the detailed instructions provided on the iOS SDK Overview Webex Developer page to enable additional logging. To obtain logs directly from the device using Xcode, see our guide on GitHub which outlines the process.
The SDK also includes the webex.getLogFileUrl() (reference guide) function for programmatically gathering logs. For sample code demonstrating how to implement the webex.getLogFileUrl() function and attach the log file to an email, you see it’s usage in the Webex iOS SDK sample application on GitHub.
The SDK also supports uploading diagnostic logs directly to the Webex backend using webex.uploadDiagnosticLogs(), eliminating the need to manually extract and share log files. Additionally, the SDK can automatically detect SDK-related crashes and upload the relevant diagnostics on the next app launch when enabled via webex.enableCrashReporting(true). For full details on these APIs, including response handling, requirements, and limitations, see the SDK Diagnostics Log Upload wiki guide.
In the event of app crashes, analyzing crash reports can be crucial for identifying the root cause. Apple's guide Diagnosing issues using crash reports and device logs offers valuable insights into diagnosing iOS app crashes effectively.
Android SDK
Like our other Mobile SDK’s, the Webex Android SDK provides settings to control the logging level of the logs generated by our SDK for troubleshooting purposes. To capture comprehensive logs during troubleshooting set the log level to verbose using the webex.setLogLevel(Webex.LogLevel.VERBOSE) function.
You can also use webex.getlogFileUri()(reference guide) function from the SDK to get a file URI where all the logs are stored. We also provide an example demonstrating how to gather logs into an email for Android located here in our Android SDK Sample Application on GitHub.
The SDK also supports uploading diagnostic logs directly to the Webex backend using webex.uploadDiagnosticLogs(), eliminating the need to manually extract and share log files. Additionally, the SDK can automatically detect SDK-related native crashes and upload the relevant diagnostics on the next app launch when enabled via webex.enableCrashReporting(true) (requires Android 12+ / API 31+, release builds only). For full details on these APIs, including response handling, requirements, and limitations, see the SDK Diagnostics Log Upload wiki guide.
Additionally, the Android system logger utility (Logcat) can be used to collect logging from the Android system which can be useful for troubleshooting. You can use the Logcat command-line tool to collect, view, and filter all logs. See the Write and View Logs with Logcat contents for more information (https://developer.android.com/studio/debug/am-logcat).
Further Android Developer documentation for logcat usage is available at:
Collect Device/RoomOS Logs
To gather logs from Webex Device or RoomOS, please refer to the detailed instructions provided in the Collecting Logs from Webex Cloud Video Devices guide on the Cisco Support site.
For issues related to Macros, it is crucial to review and share the console history available in the Macro Editor on the device's local web portal. This can provide insights into any errors or unexpected behavior. For further information and guidance, consult the Macro tutorial.